
20+ Hours Saved: How We Helped a Veterinary Hospital Streamline Their Intern Candidate Decision Making Process
TL;DR: Veterinary Internship Selection Automation
The Challenge
A Chicago veterinary specialty hospital faced an overwhelming internship selection process: 41 candidates competing for 6 positions, with 12 doctors providing feedback (492 total data points). The manual process consumed 20+ hours of the director's time chasing feedback, summarizing comments, and making decisions based largely on "vibes" rather than data.
The Solution
Ushiro Labs built an automated "Candidate Summarizer" spreadsheet system that:
Collected structured feedback from each doctor through individual, permission-controlled sheets
Used AI-powered automation via a local LLM (Qwen 2.5:7b running on Ollama) to summarize all doctor comments for each candidate
Generated power rankings (1-41) by combining quantitative scores with qualitative feedback summaries
Delivered a final, color-coded ranking automatically sorted from strongest to weakest candidate
Technical Highlights
The system leveraged a sophisticated tech stack including Python scripts, local LLM processing, and Google Sheets integration. Two custom scripts (comment summarization + power ranking) made 82 API calls total, processing ~58,000 tokens per run—completely free by running locally instead of using paid APIs like OpenAI (which would cost $0.38+ per run and add up over time).
Key Results
20+ hours saved for the intern director
40% increase in doctor response rates
100% data-driven decision making (vs. previously qualitative guesswork)
Repeatable system for all future intern classes
$0 operating cost - fully local, no ongoing API fees
Deadline met for the first time in years
"Ushiro Labs was a game changer for our intern interviews. By automatically averaging candidate ranks and summarizing doctors' feedback, it streamlined our review process and saved me hours while improving clarity and consistency in candidate evaluation."
— Hospital Intern Director
I. Introduction
Imagine an emergency veterinary hospital overwhelmed with the most internship candidates they’ve seen in a long time, all vying for internship positions at one of the most respected and well known hospitals in the region. With 41 applicants but only 6 slots available, the selection process became daunting. Each candidate had their own skills, talents, and interests and presented themselves as the perfect candidate for the hospital, but not all 41 could be accepted. Each candidate needed to have their qualifications analyzed and meticulously evaluated and ranked. With 12 doctors all having an opinion on each candidate (492 total data points of candidate feedback), the task was looking like it was going to be a difficult thing for the doctors to manage while also working their normal jobs in the hospital.
This is the problem that Ushiro Labs was tasked with solving when approached by a veterinary specialty hospital based out of Chicago. We were to come up with a solution which would streamline the selection process for the internship candidates, effectively incorporate feedback from all of the doctors, and provide a quantifiable way to rank all candidates to make the decision making process go much faster. More so than anything, this needed to save time for all of the doctors. They couldn’t afford to spend time away from their patients, and they needed a way to do this without sacrificing quality.
Through extensive collaboration with the director of the intern program at the hospital, we would work to come up with a solution that would not only work for this intern class, but could be repeated for all intern classes in perpetuity. So not only were we tasked with creating a solution for now, but we were also tasked with creating a solution for 5, 10, maybe even 20 years from now.
The following case study is a real world application of Ushiro Labs’ knowledge base, showcasing the kind of work that we perform for our clients, and explaining the thought process behind every decision that was made throughout the course of the project.
II. Project Background & Objectives
To start off with, the hospital that we worked with is one of the more respected in their area. Due to privacy reasons, the specific hospital will not be named, nor will any Doctor or candidate names be shared.
This hospital has always had a good showing of intern candidates with each intern class. With only one application window a year and only 6 slots available, these were very high stakes positions. Not only was it important for the students so they could get proper clinical experience, but the hospital also had a reputation to uphold. They operate in a very high stakes, fast paced environment so they could not afford to have an intern who wouldn’t be able to hit the ground running. Ensuring that they have the most qualified and capable talent that they can every intern rotation was of utmost priority to them.
In previous years, the hospital intern director has had a very difficult time managing the workload of this initial application process. Working full time as an emergency department vet while also being the hospital intern director means that she had very limited time and needed to find a way to manage all of the needs of each intern application season.
In years past, she would use a very manual process when it came to selecting the candidates. She would send out an email to all of the doctors participating in the feedback and review rounds, and after that, she would then have to constantly remind the doctors to get their feedback on each candidate back to her by a certain date so that she would have enough time to gather everything and make a decision.
Once she got all of the feedback, which would often times be sporadic and she would be missing comments from other doctors even, she would then manually go through each comment left by each doctor for each candidate and take her own notes from that, attempting to provide an adequate enough summary to help aid her decision.
After spending countless hours chasing down feedback and trying to summarize all of the notes on each candidate, she would then need to make a decision based off who she felt were the best candidates in the intern class. Pretty much all qualitative feedback, little to no quantitative feedback, and quite frankly, an arbitrary decision making matrix.
The director had realized that this wasn’t a sustainable approach, especially if their intern class applications were to keep growing each year, so knowing that, she contacted us at Ushiro Labs to help her solve this issue.
Her main requests were as follows: she needed a system which would be easily repeatable for each intern class, bring in data points to make it easier to analyze each candidate, and save her the hours of time that she spent manually doing all of this.
Knowing that, we generated a list of goals in collaboration with the director of what we would like this solution to achieve. The results of that conversation were as follows:
Something that brings actual data to the decision making process, not just “vibes”
Easily repeatable and can be used for any intern class moving forward
Automation wherever possible
No more manual summaries
A scoring and decision making system which would empirically select the best candidates in that class and rank them based off of the data from all the doctors
Something that was simple to use from a user interface but could achieve all of the complex asks with minimal involvement from the director (she stated she wasn’t very “tech savvy” so she’d like to avoid as much as she could when it came to the backend workings of the solution.)
Knowing all of that, we at Ushiro Labs decided that the best approach was to create a spreadsheet which would bring together all of those requests. Spreadsheets are a familiar user interface (UI) and something that any doctor could understand, so combining that UI with complex workings under the hood through formulas and tools, we knew we would be able to create something that would truly bring value to the hospital.
III. Solution Overview
After working on this project, we were able to come up with a spreadsheet called the “Candidate Summarizer”, shown below.
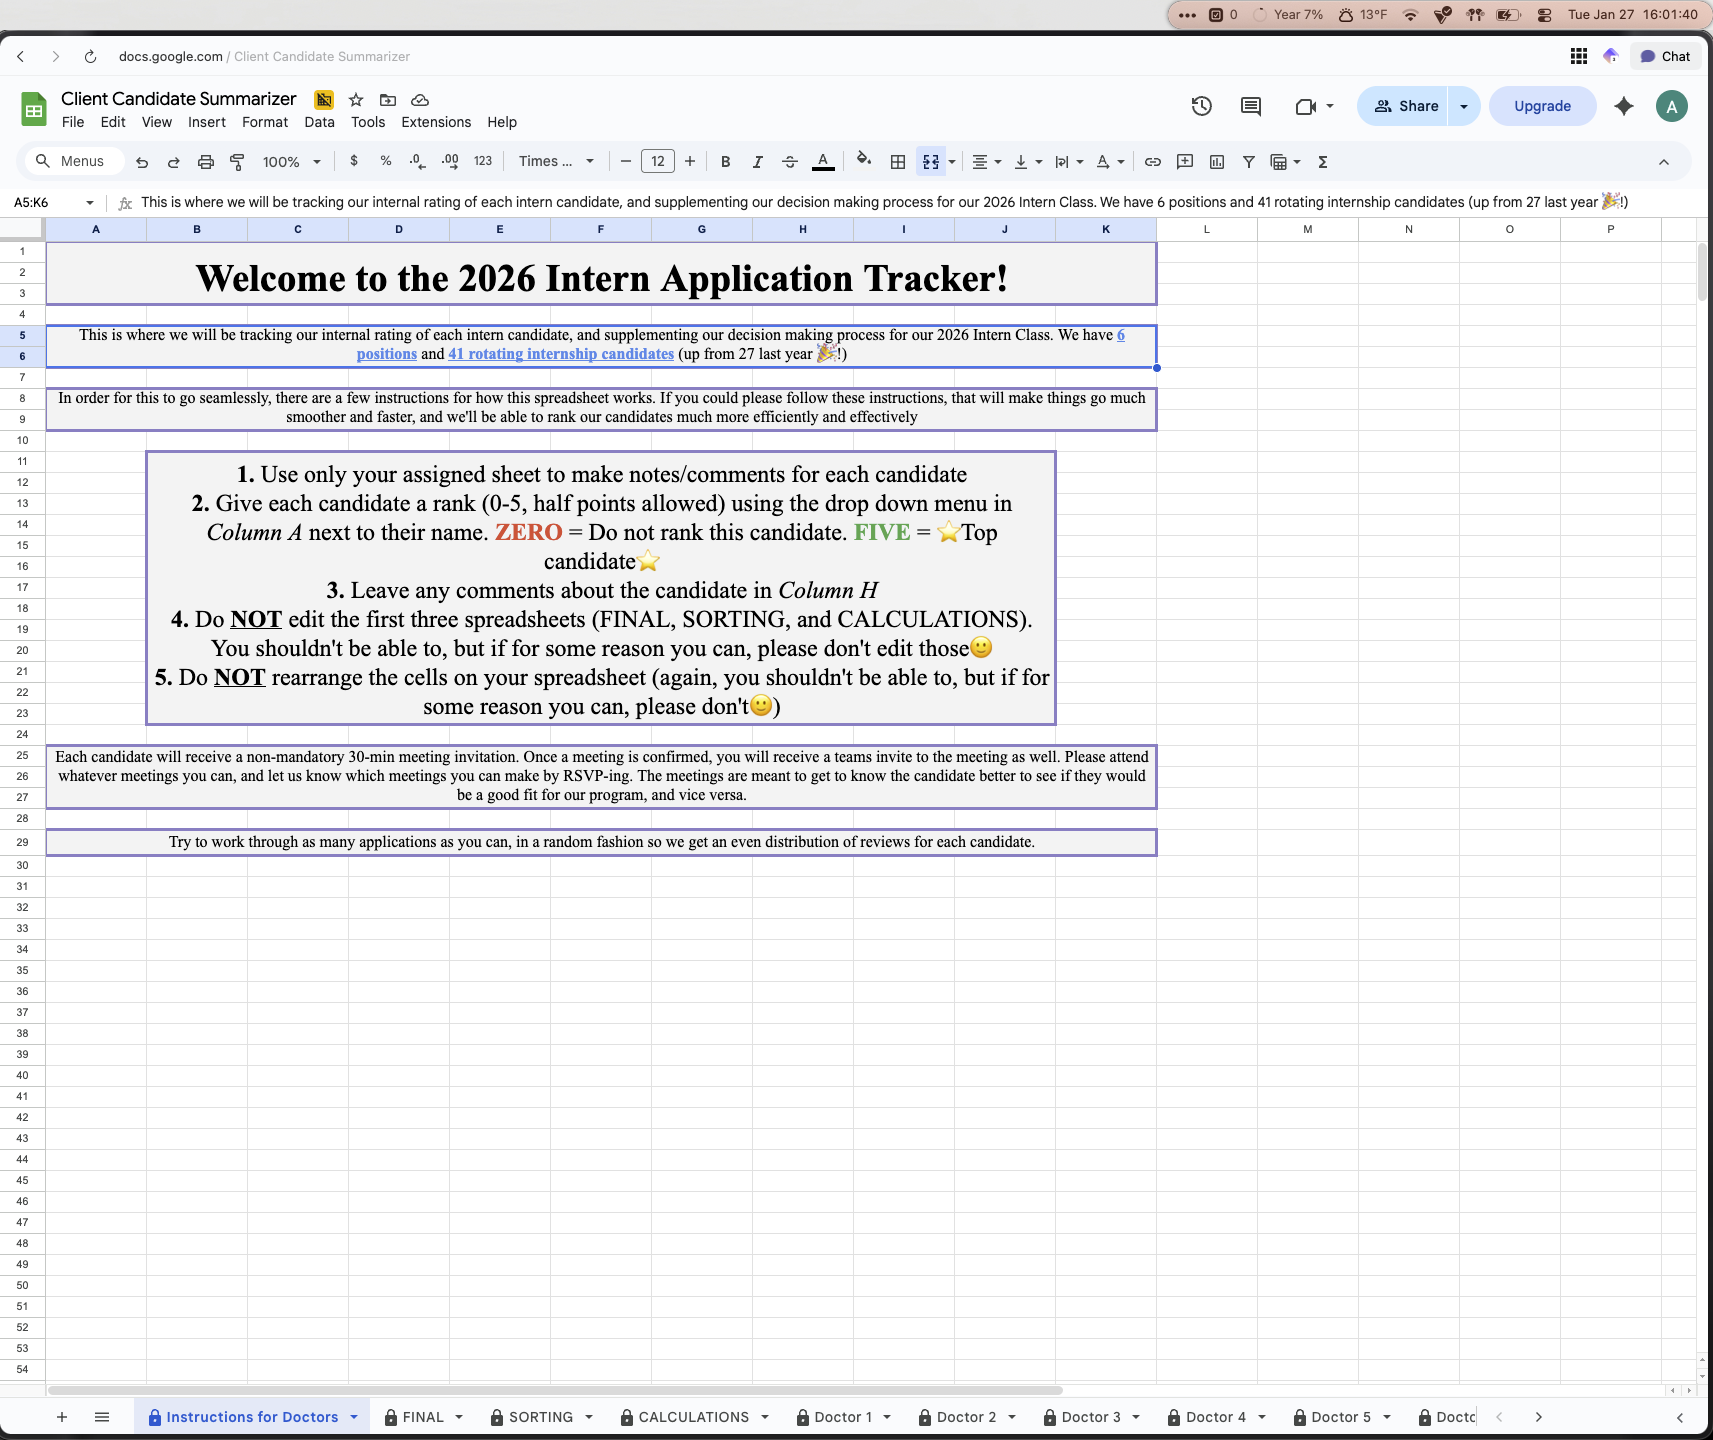
Introduction Sheet
There are a few things to point out which greatly improved both the adoption of this solution, and also the effectiveness:
There is an explicit instruction sheet for doctors as the first page. This outlines the instructions for the doctors participating in this review, so rather than them needing to find an email where instructions and expectations were outlined, this is the first thing they see any time they open the spreadsheet
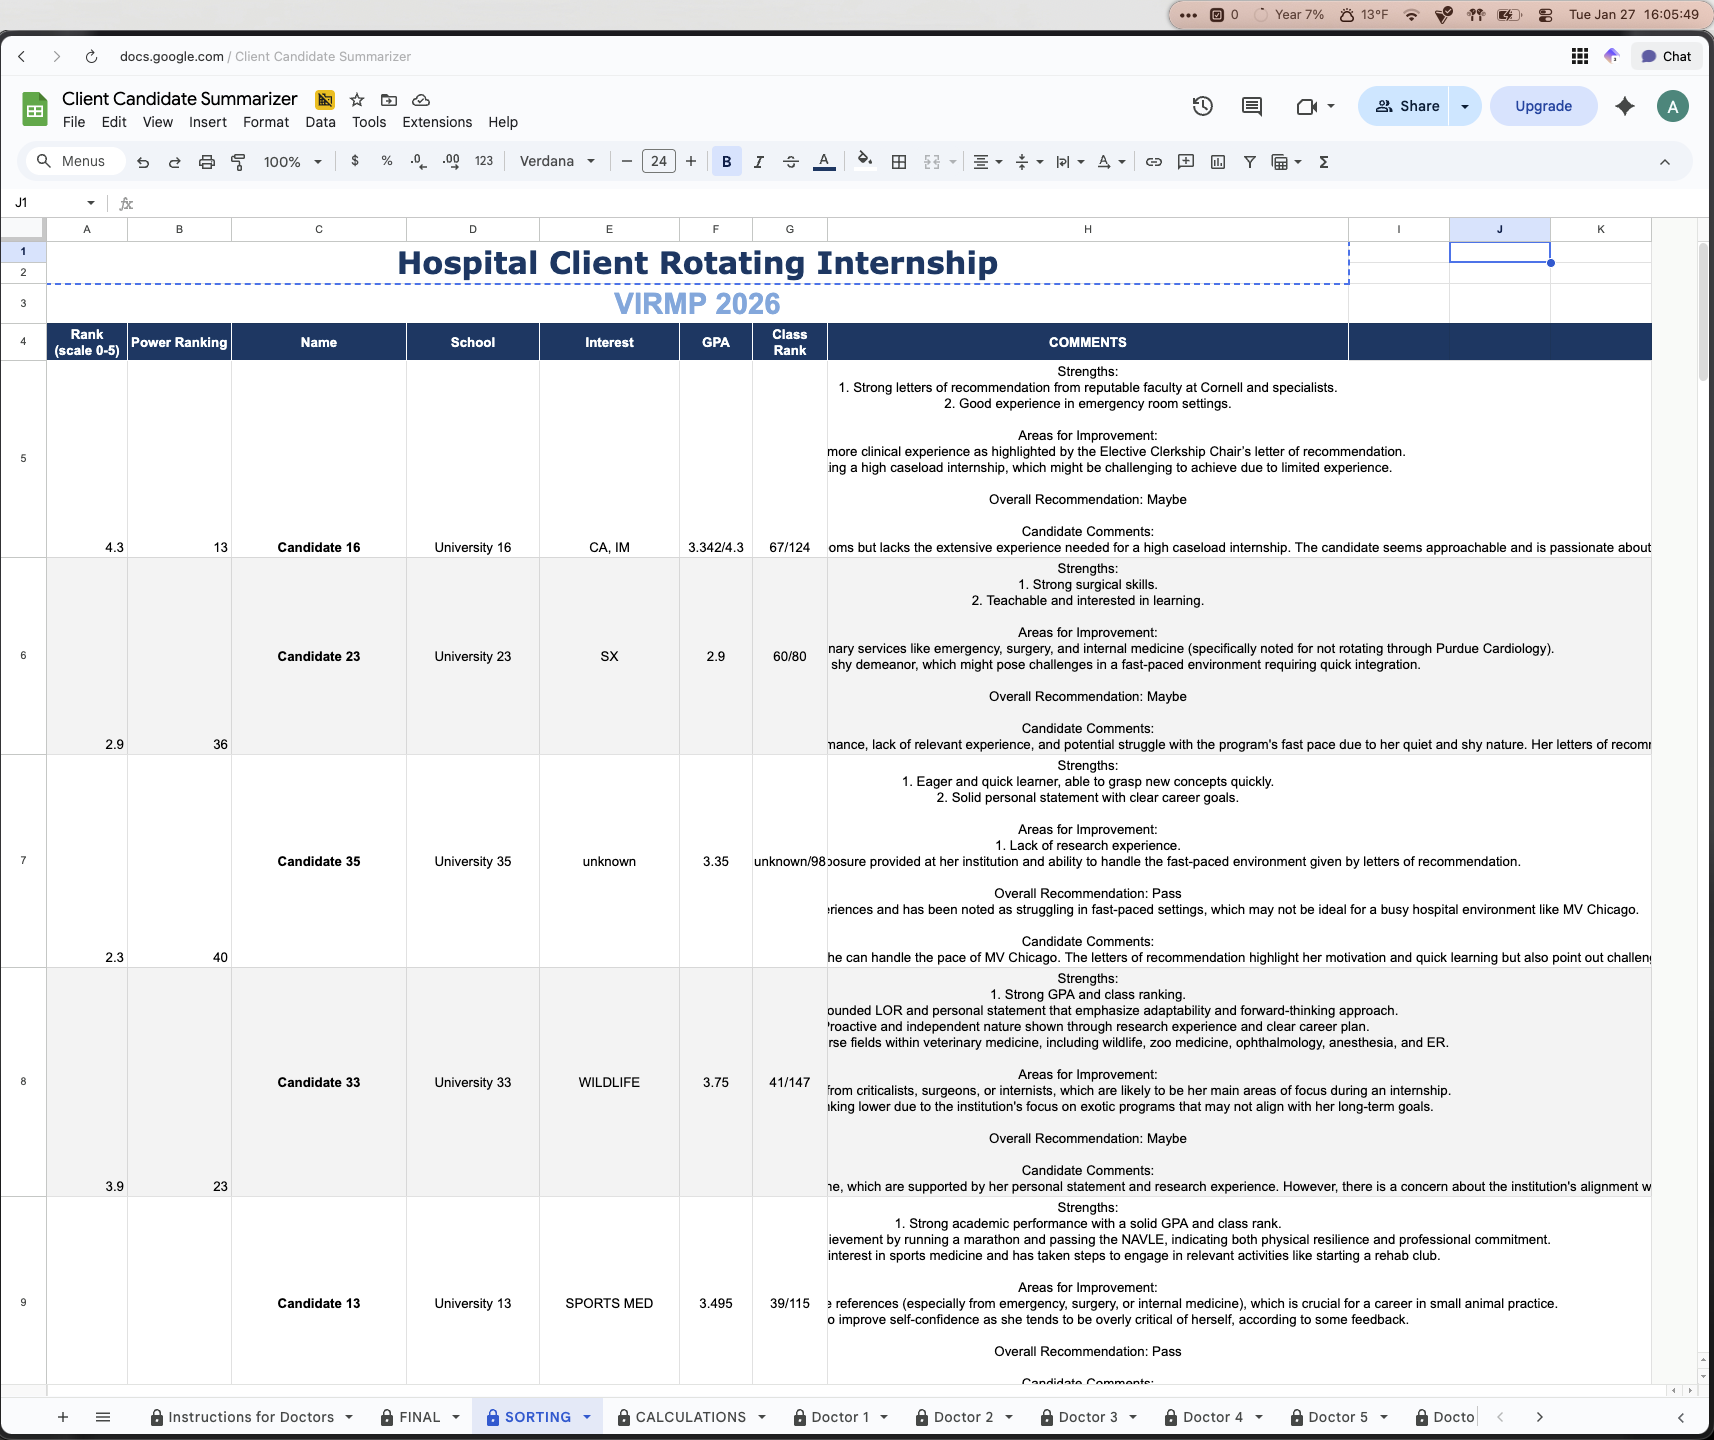
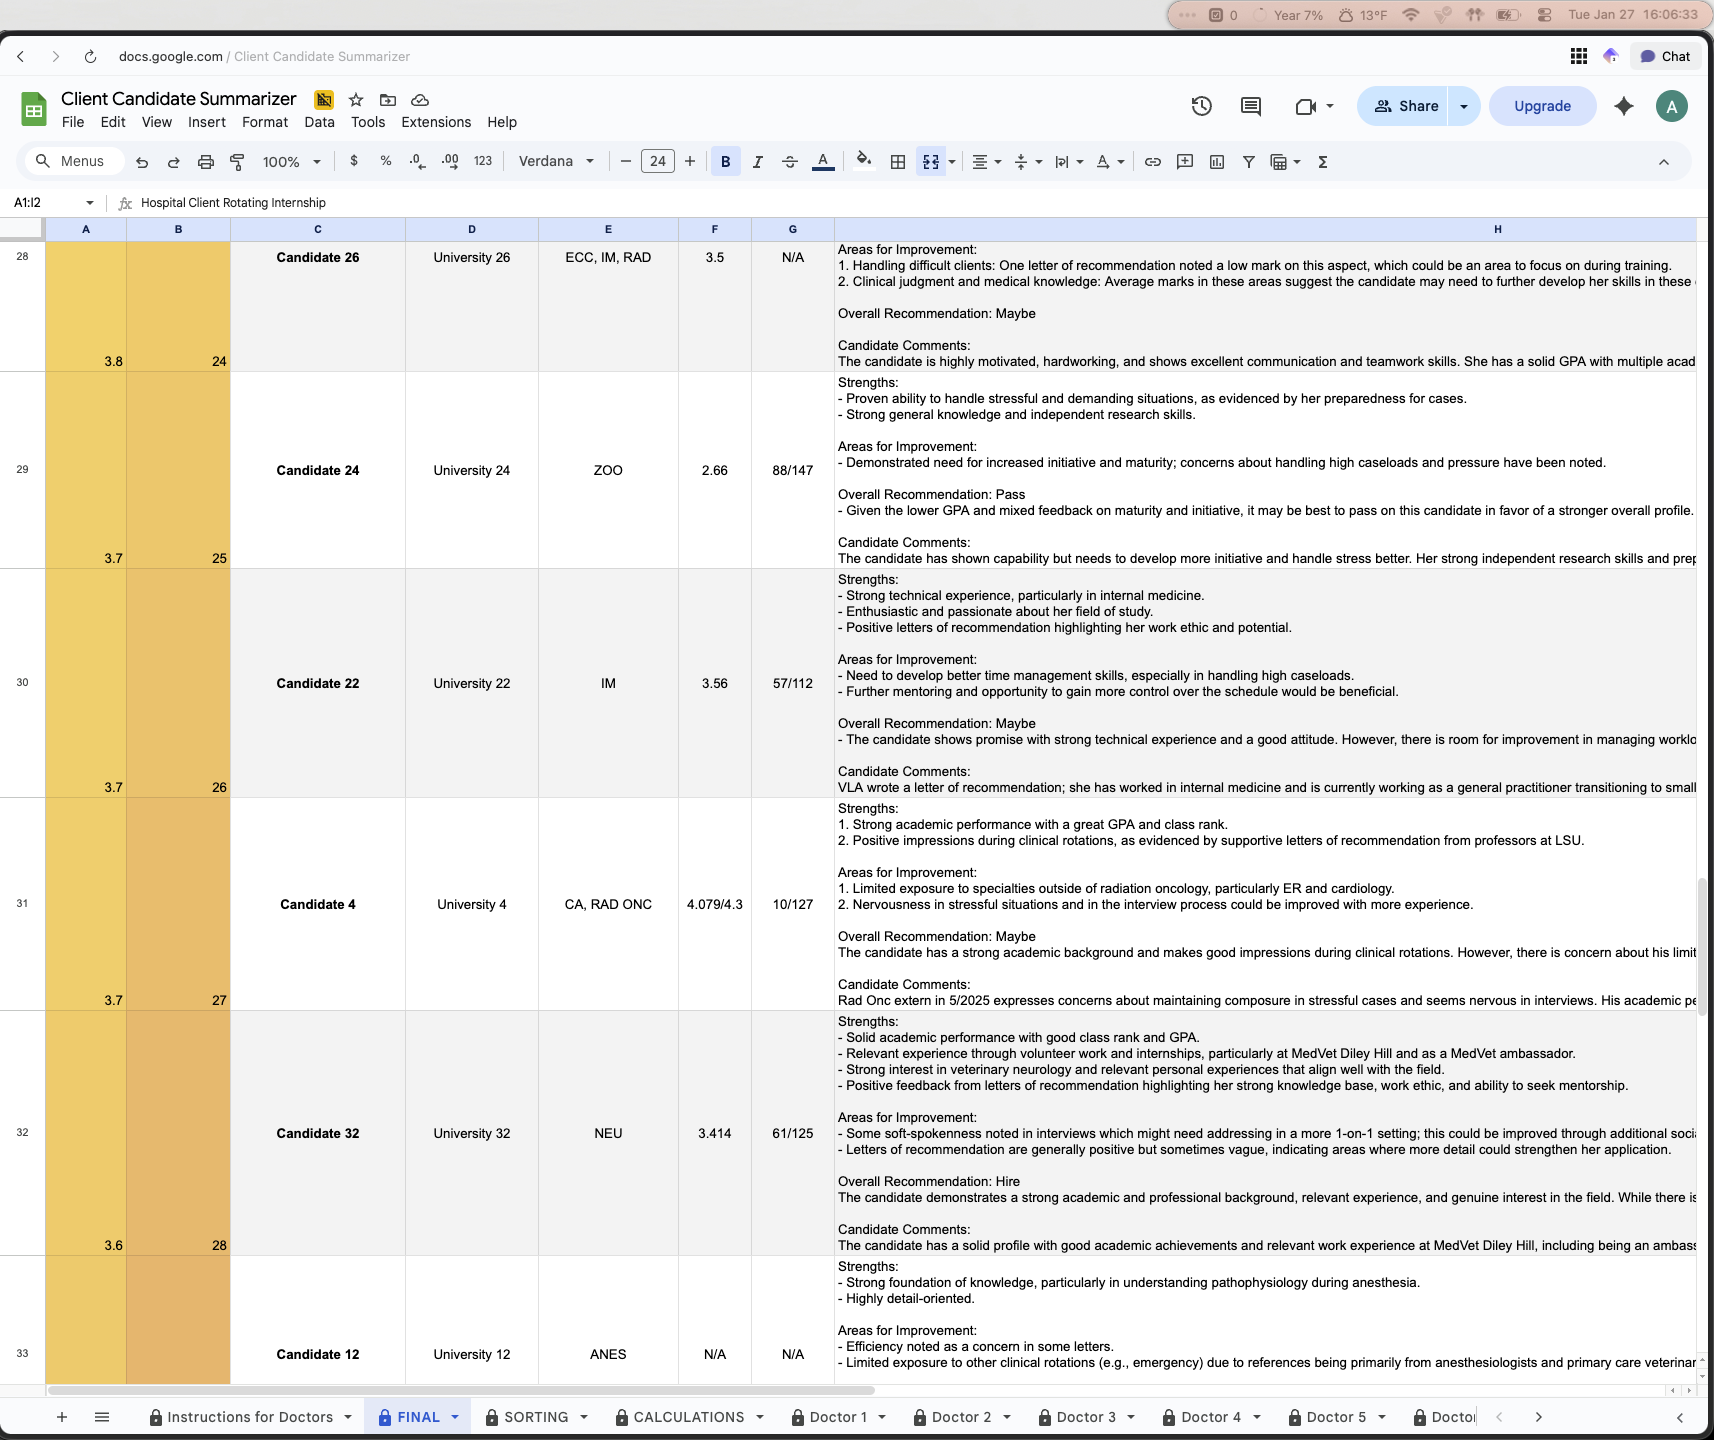
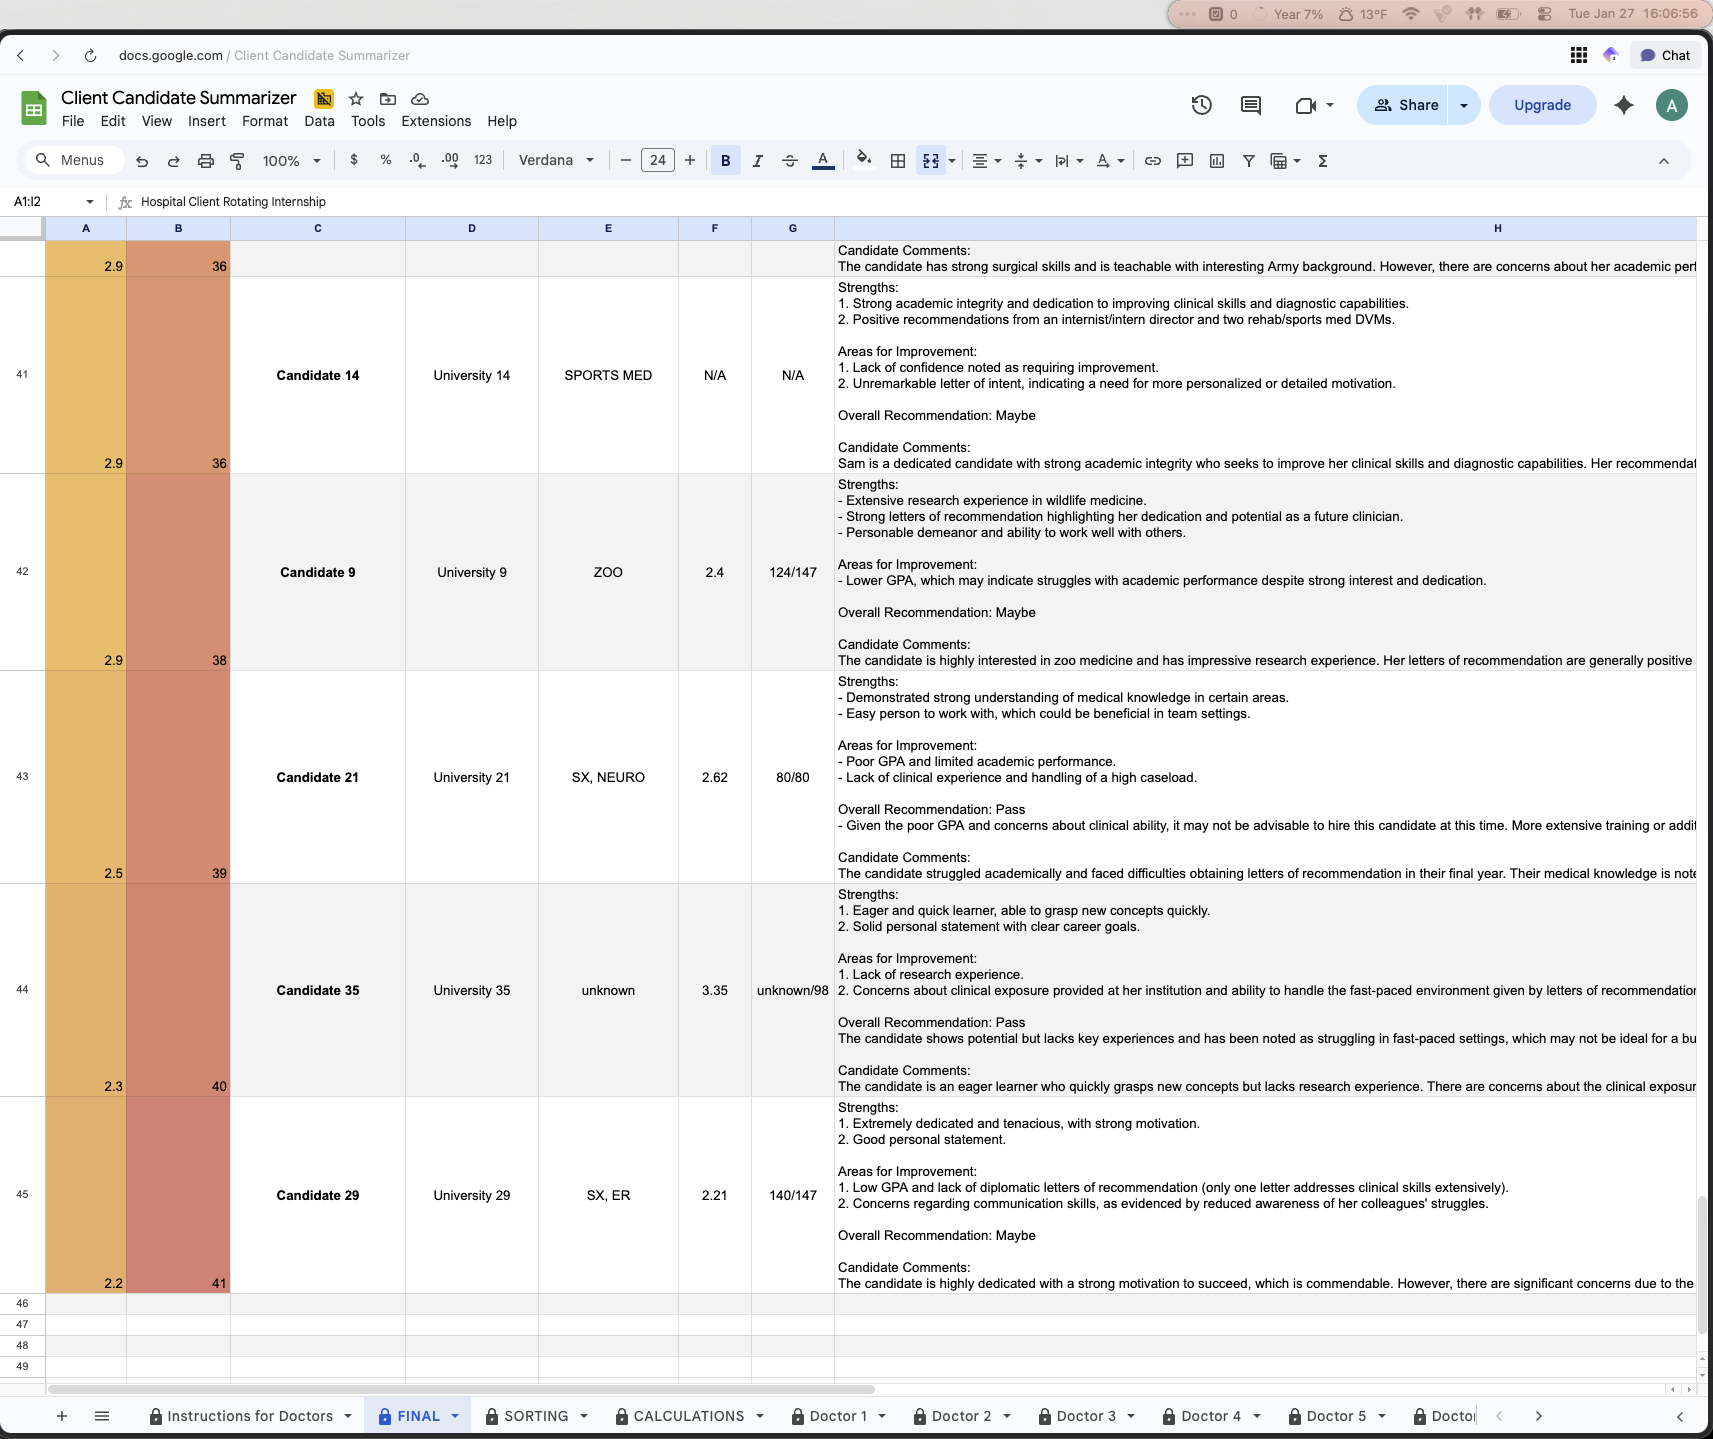
The second page titled FINAL is the final scoring system with the fully filled out decision matrix. This is an automated sheet which based on a score, along with comment summaries, automatically ranks all of the candidates from strongest to weakest candidate
The SORTING and CALCULATIONS sheets are intermediate step calculation sheets. These are not touched and are simply neater ways to filter and sort through the raw data from the doctors. These use various excel sheets and computer programs (more on that in sections IV through VI) to automate the processes behind the scenes.
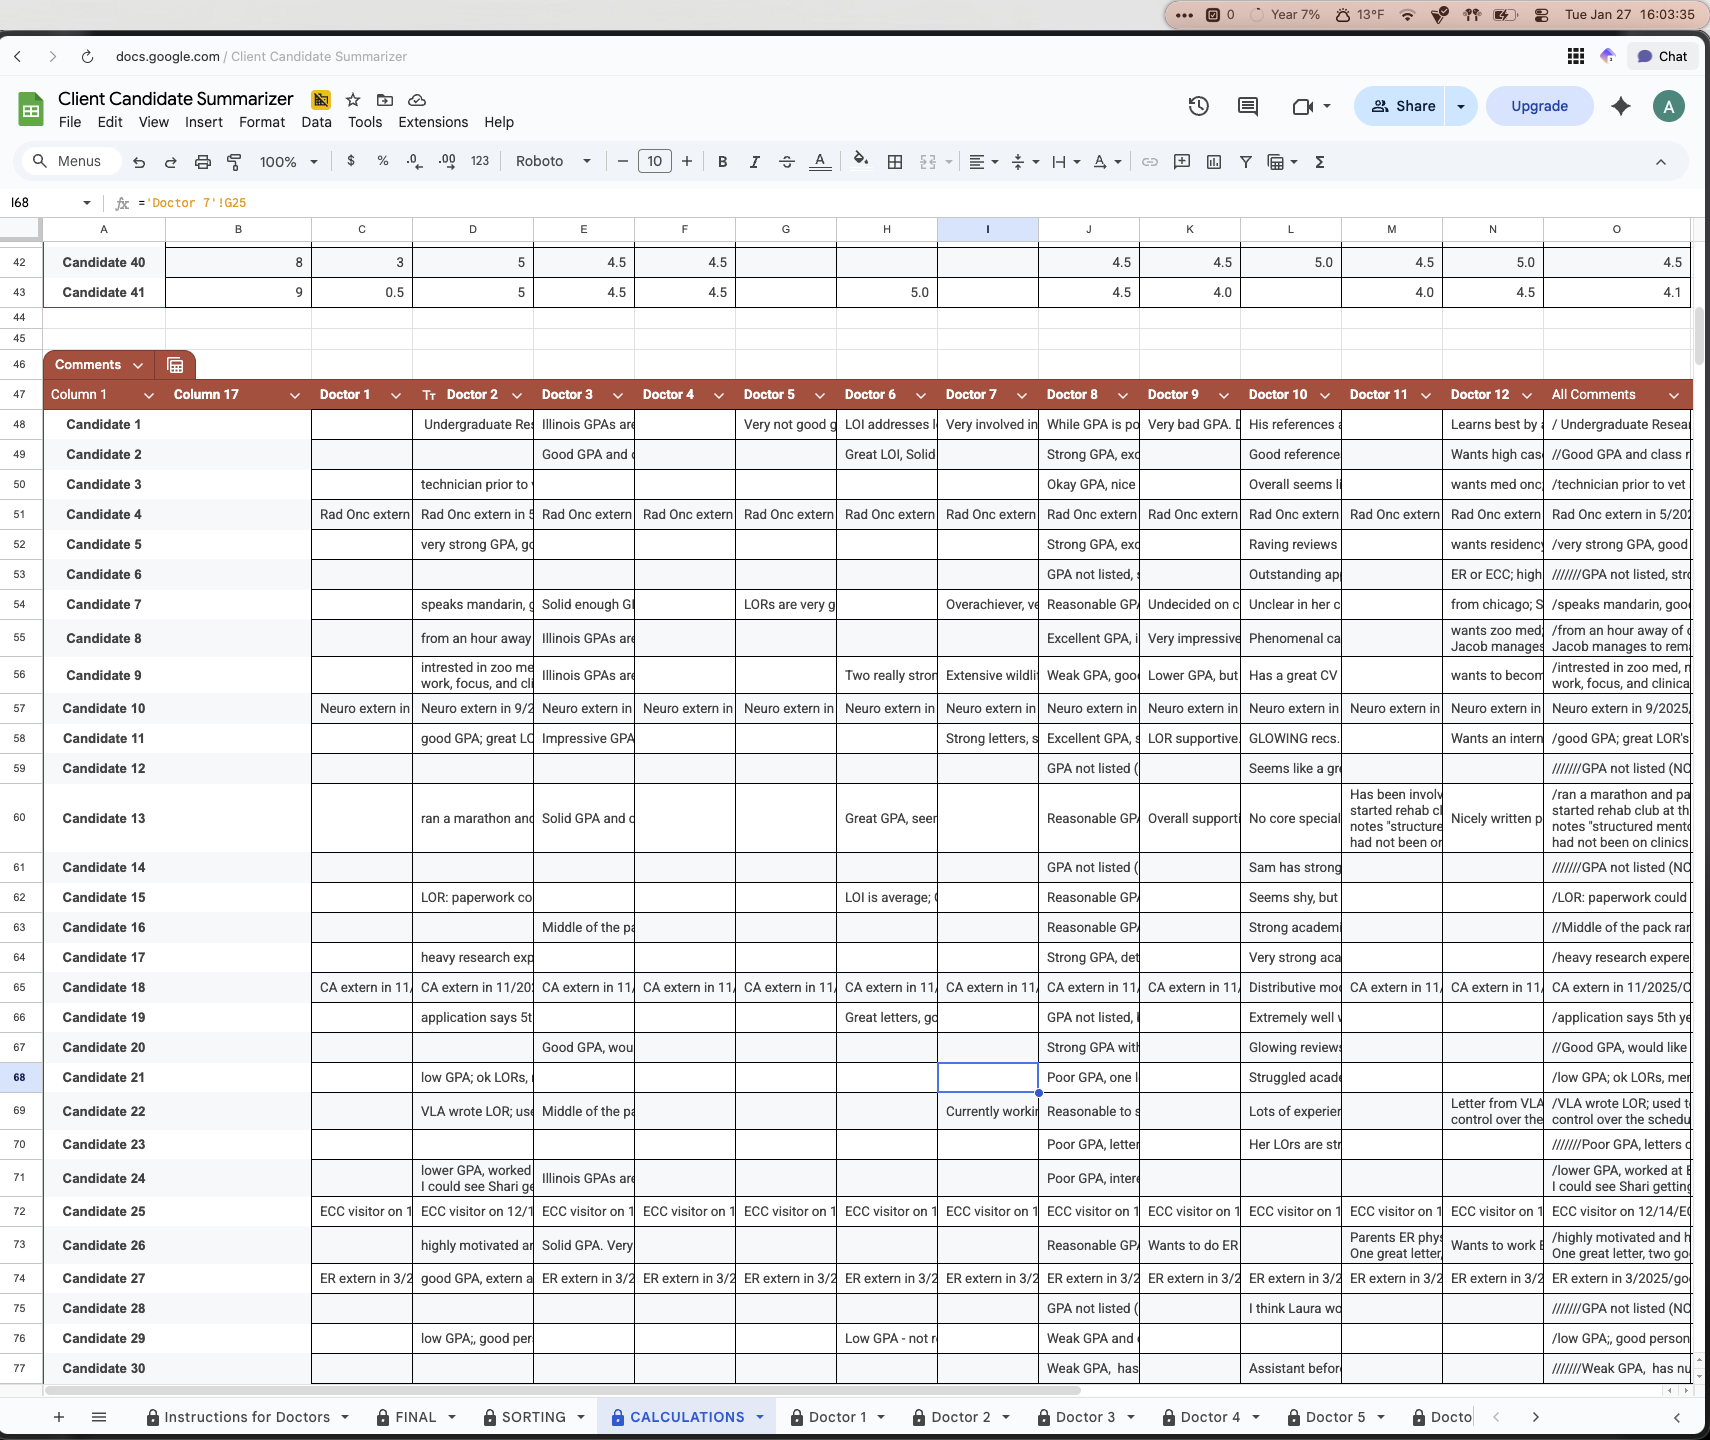
Each doctor had their own page with each candidate on there. The candidate name, university, their professional interests, their GPA, and also their class rank was included. The doctors were then limited to only being allowed to do two things for each candidate: Give them a score using a dropdown from 0-5 (5 being the high score), and add any comments for the candidate
All doctors were only allowed to score and leave comments for the candidates on THEIR sheet. What this means is Doctor 1 could only edit on their sheet, they could not go into Doctor 2’s sheet and change anything. We did not expect doctors to go into each other’s sheets, but accidents happen, and this step was taken as an additional precaution.
Ushiro Labs and the intern director were the only ones with full edit privileges across the entire sheet. All other doctors were restricted to what was described in Bullet 5
This solution was very effective and the hospital was very happy with the end product. What this did is it created an organized way to bring together all of the sentiments on the candidates, it automated all of the manual tasks which previously ate up a lot of time, and it also created a repeatable system which could be used in perpetuity for any size class of interns.
Also, a repeated piece of feedback that we received from the doctors was that this sheet was easy to understand and navigate. They didn’t need to teach themselves anything new or use a software that was foreign to them. They got given clear instructions, found the sheet with their name, then simply chose a score from a dropdown and typed some comments and that was it. The system then took care of the rest and each doctor saved MANY hours of deliberation and going back and forth with the other doctors to decide on who were the top candidates.
Now that we’ve gone over what this sheet looks like at a high level, the next thing is to get into the nitty gritty of how this works, and what makes it so effective when it comes to solving the problem that this hospital had.
IV. Technical Implementation
To start off, the first thing that we needed to figure out was how we were going to go from collecting data from each doctor on the candidates to an automated ranking system which took their scores and comments and made the decision for them using quantitative data.
After some deliberation, we came to the following mapping for how we would go from feedback to decision
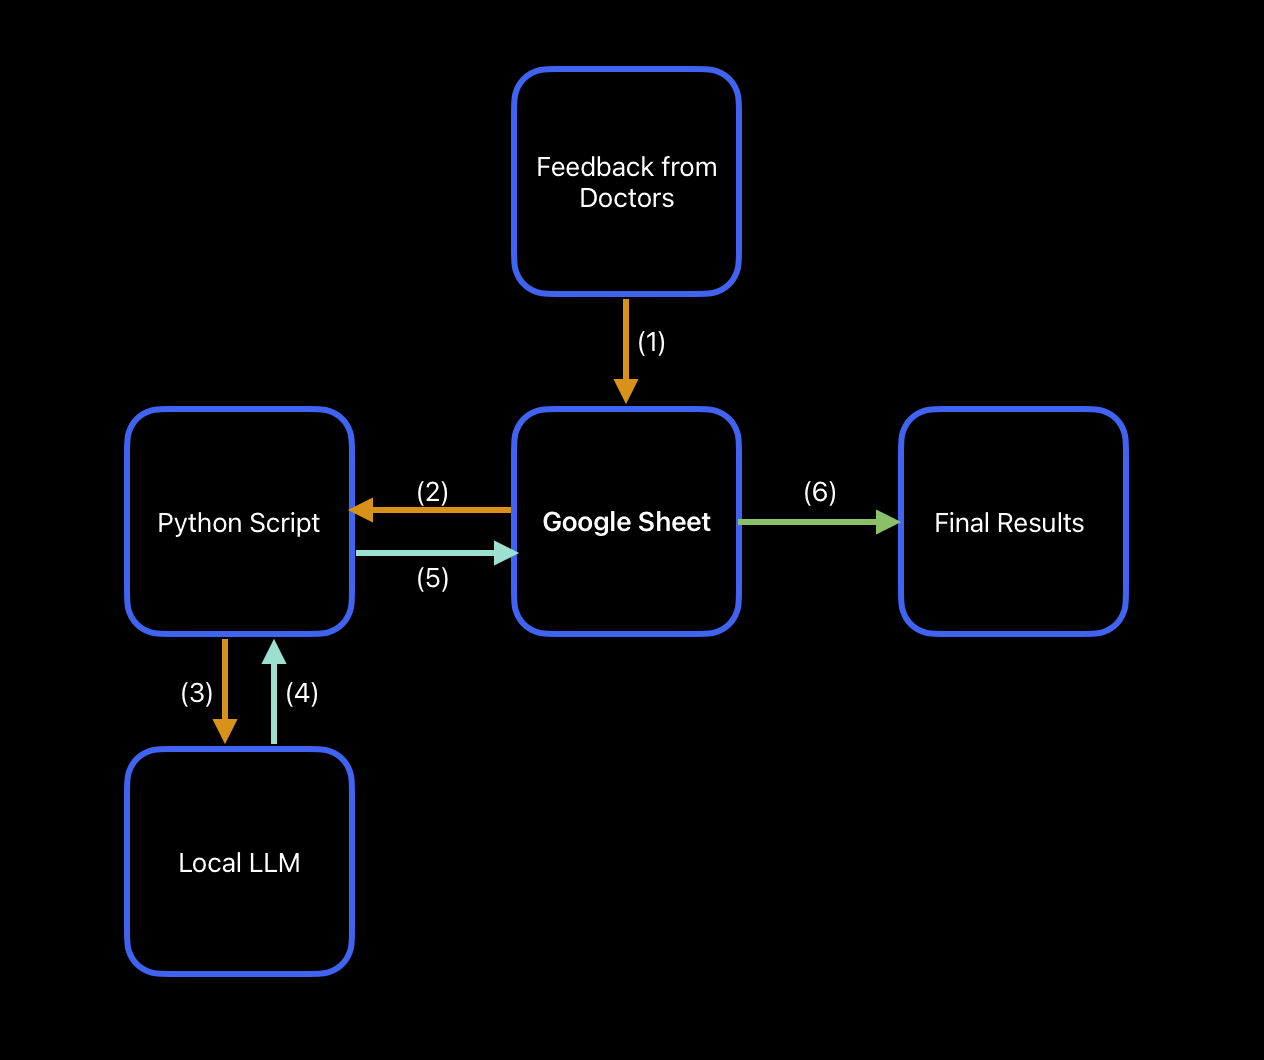
Solution Workflow Mapping
This is a simplified version, but essentially it would be:
(1) Doctor feedback → Google Sheet
(2) Google Sheet → Python Script
(3) Python Script → Local LLM
(4) Local LLM Results → Back to Python Script
(5) Python Script → Back to Google Sheet
(6) Google Sheet → Final Results
The first step of this tree was collecting the actual feedback from the doctors. Without any scores or comments, this solution would just be a pretty, dust collecting spreadsheet, so we needed to collect data. We designed a spreadsheet structure which made it easy to give feedback. You know exactly who the candidate is, what their qualifications are, and you have a place to insert feedback right then and there. Something to note is that with each candidate, there was the option to attach any letters of recommendation or other supporting documents that they might have directly in this spreadsheet to make it even easier to be able to analyze them all in one spot. So, if you were to click on their name, this would open up any supporting documentation that they might have provided. For privacy reasons, all of these links were deleted from the spreadsheet prior to publishing this case study, but it does have this functionality built it.
After that, the raw data would go into what we call “Sorting sheets.” These had the function of congregating raw data from each doctor in one central location so you wouldn’t have to click into each doctor’s sheet to see what they said about a candidate. On top of that, the main benefit of a sheet like this is having all of the data necessary for any automations and computer scripts in one place. Rather than having the scripts search cells all over the sheet, it would just have to look in one location, and this improved both the speed and reliability, since the chances of there being a mistake while feeding data into the computer program went down. Troubleshooting also becomes much easier when you need to look in less locations for where the errors might be coming from.
The next step, mentioned in the previous paragraph, is a script which automatically can perform the data analysis for us. This script would get data fed into it, process the data, and then return the results back to the google sheet. With how capable AI is and how central it is at the toolset we use at Ushiro Labs, it only made sense to use it to help with this step (more details on that later). There were two main things we needed to do: First, we needed to take all of the comments from each doctor for each candidate and summarize those into something more digestible. Second, we needed to take the average score each candidate got along with the comment summaries, and use that to create a power ranking for them. By using this power ranking system, rather than just deciding strongest to weakest candidate by average score alone, we were able to take the qualitative AND quantitative data and bring those together to create a ranking system, removing all ambiguity from the candidate selection process.
Lastly, the full data was returned from the script back into the spreadsheet, and the spreadsheet then used a formula to sort the candidates from best to worst using the processed data. This final step would take all of that processed data that was returned from the script, assign it to the correct candidate, and then based on their calculated power ranking, order them from best to worst (also color coded for an additional visual cue) to make for easy decision making.
Although that 5 step process looks very simple, getting it to work effectively took a lot of iteration and collaboration with the intern director, which we are going to cover next.
V. Intermediate Steps: Data Collection, Analysis, and Decision Making
The first step of this was collecting data, both on the candidates and from the doctors.
Candidate applications needed to be sorted through manually for this iteration as each application looked slightly different, however, in future iterations of this solution an automation to pull in all relevant candidate information from their application will likely be implemented. That being said, we had decided that in order to effectively categorize the candidates, we would need their: name, university, interests in medicine, GPA, and class rank. This would paint enough of a picture so that each doctor could glance at the candidate in the spreadsheet and remember who exactly they were. Combine this with any attached documentation like letters of recommendation or cover letters, and each row was a full picture of each candidate.
After all of the candidates had been populated into the spreadsheet, the next step was simply to create a sheet for each doctor.
This was a simple decision to make since we wanted each doctor to have their own sheet where they could have their scoring and thoughts. Having one large sheet which all of the doctors worked on would be a very error prone approach, and also fatiguing because each doctor would need to find their designated section in one sheet, rather than having their own sheet to work in. As a general rule of thumb, if you have different people working on a project, all with distinctly different contributions, it’s a good idea to consider having them work in their own sheet and then combining things with formulas in a separate, combined sheet (like we did).
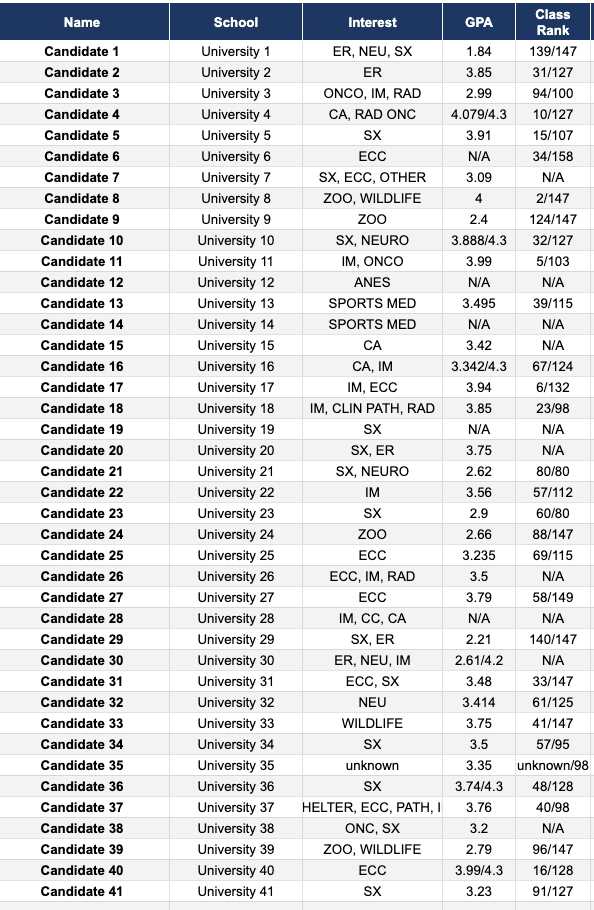
Candiate Info
Once we had set up all of the doctors with their own sheets to work in, the next step was the data extraction from those sheets, which was done in the CALCULATIONS and SORTING sheets.
One question which came up during this was why we needed intermediate sheets and what purpose this actually served. The main reason for this is because when you are trying to automate something, one of the things which often takes up a lot of time during the process of creating the automations is figuring out where things went wrong and where they broke. Debugging and troubleshooting code is already time consuming enough, so if you have a script looking in 12 different sheets and pulling data, the chances that something gets pulled in incorrectly or is just blatantly missed increases dramatically. Then, from that, you’re going to have to find where in those 12 different sheets something broke and fix it, so in this case, it makes sense to pull in the data into one location and pull into the script from there. If you have a very complex and multi-layered script, then at that point it likely wouldn’t make sense to do it this way, but each situation is unique and you should examine them on a case by case basis.
So, in this particular scenario, we knew that if we have a sheet which contains all of the relevant data that will be fed into the script, we knew we would only be pulling data from one location, and it would be much easier to troubleshoot as we iterated on the code.
That being said, the CALCULATIONS sheet was the one which pulled in the raw data from each doctor sheet, specifically the score they gave the candidate and also any comments they left.
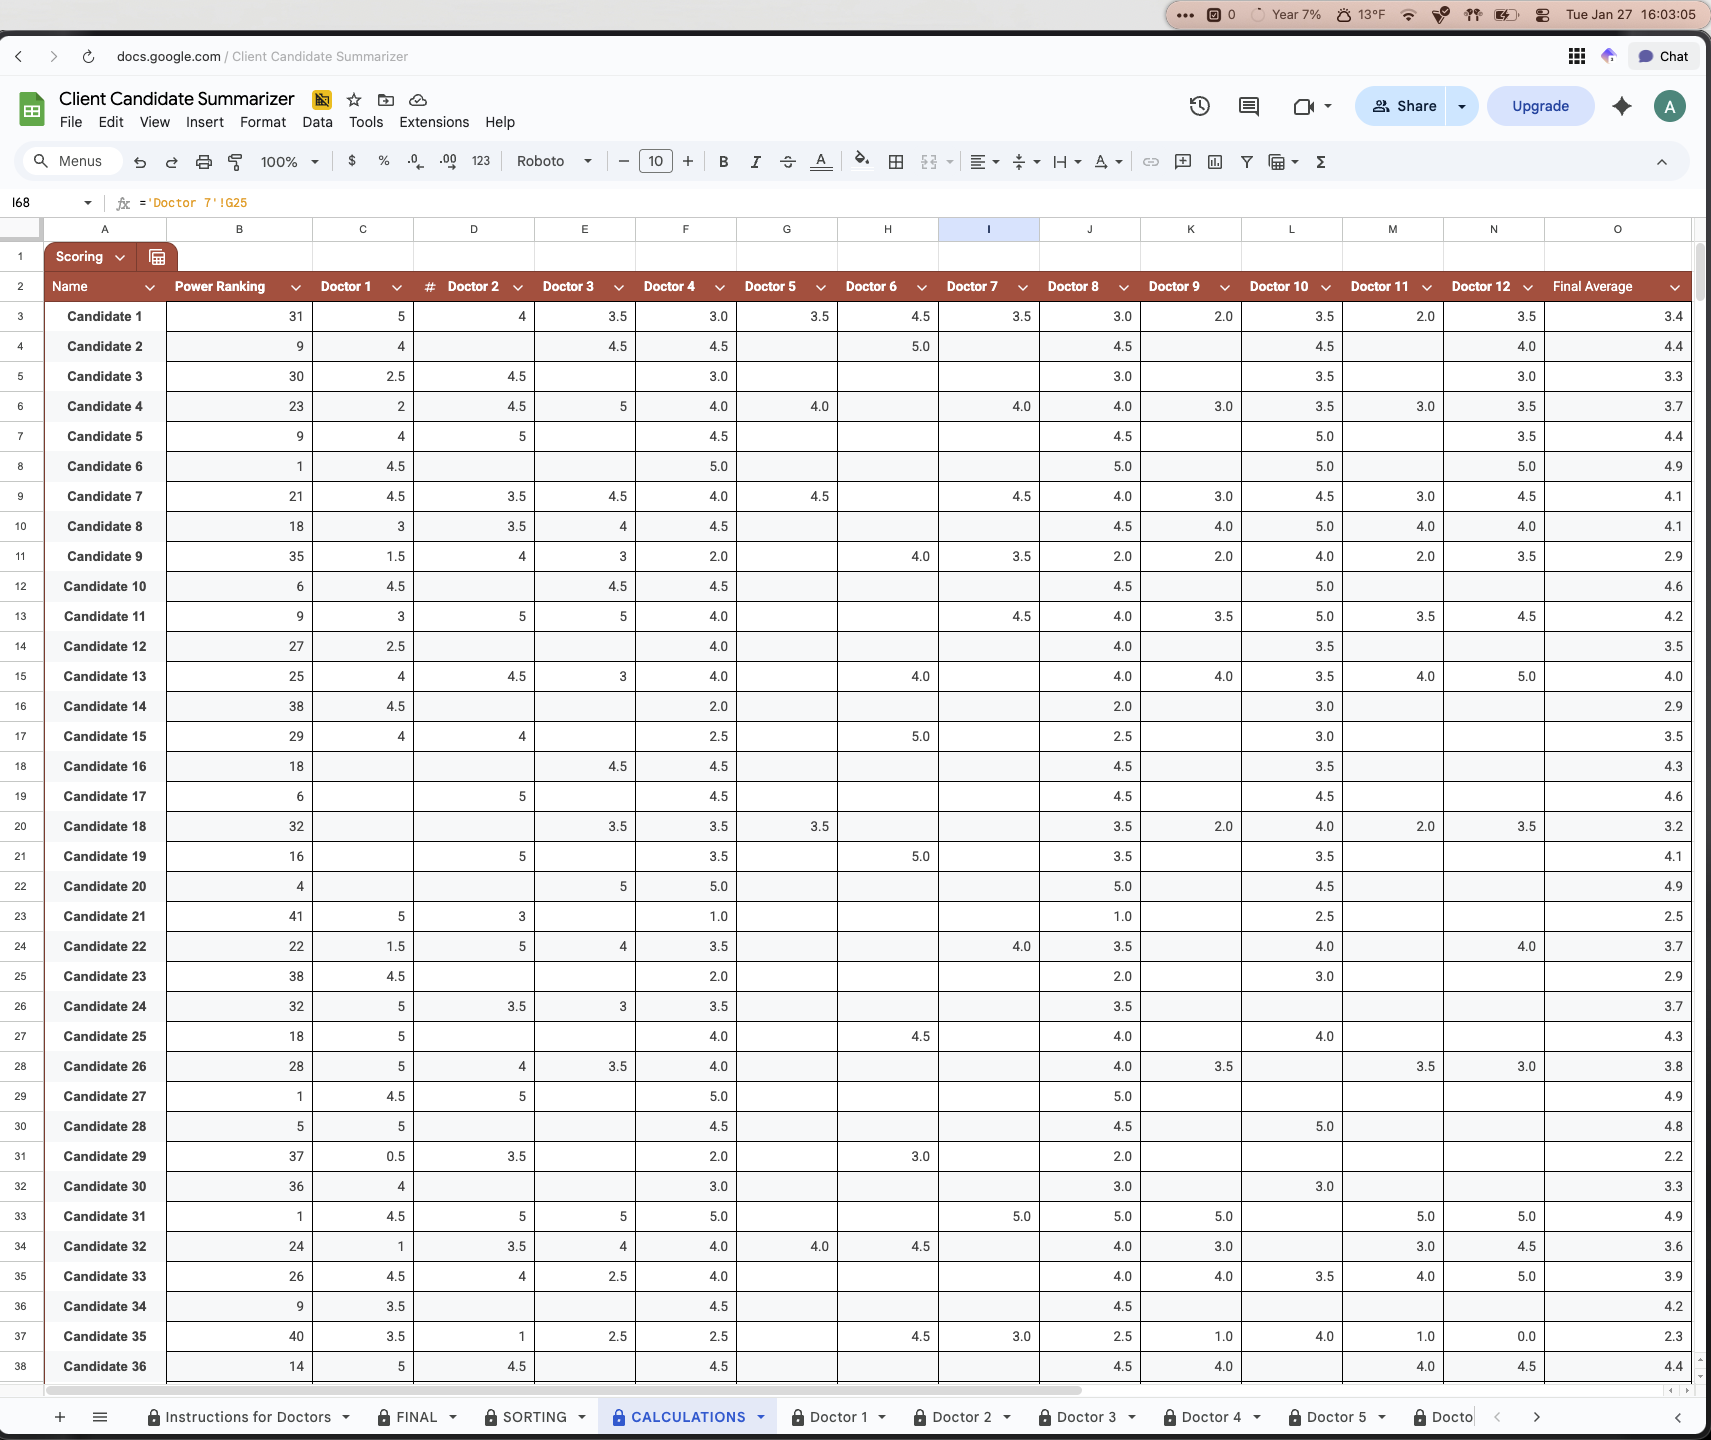
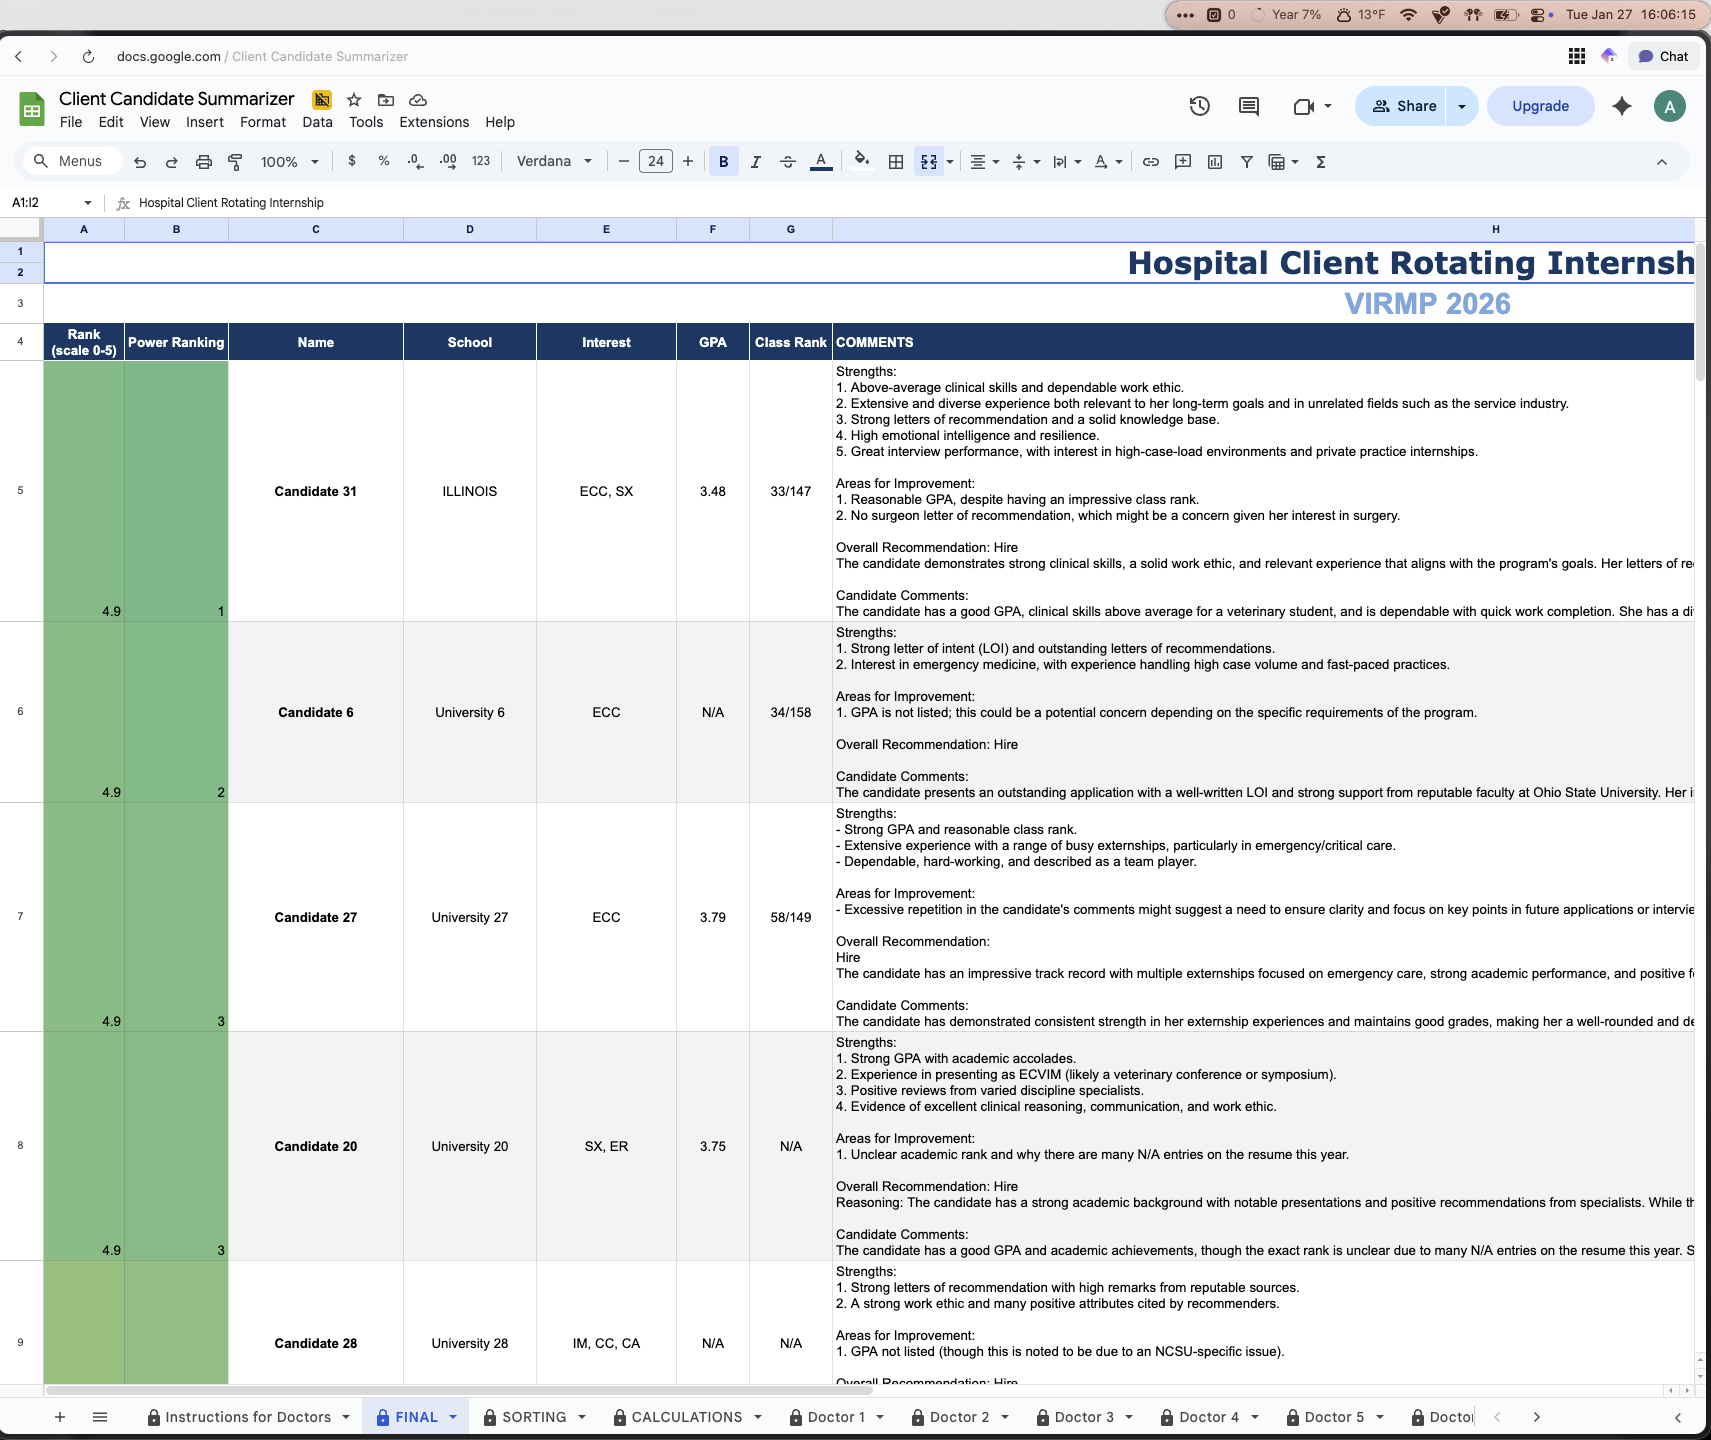
The SORTING sheet was the one that we used to act as the main intermediary step to presenting the conclusions from the data analysis in a “pretty” way. After getting the raw data in the calculations sheet, it was then collected and assigned to the candidates in the sorting sheet. Using a google sheet formula (XLOOKUP) in both Column A and Column H of the sorting sheet to find the name of the candidate in the calculation sheet, this would pull the correct associated average score across all the doctors and comment summaries and assign it to them. After they all had their scores and comments, in Column B, a script was used to take the score of the candidate in Column A, and paired with their comment summary in Column H, assign a rank from 1-41, this would be their power rank. After this point, all of the data needed to make a decision would be in the sorting sheet.
Sorting Sheet
The final step was to put this into a presentable manner, and that would be the FINAL sheet.
This sheet took the data that existed in the SORTING sheet and simply using the SORT function, ordered the candidates from 1-41 and also color coded their scores and power ranking to add a visual aspect to the rankings (green for the top candidates, yellow for average, red for worst candidates). This final sheet was the deliverable to the intern director and the hospital. Using all of the data collected and some scripts and AI, they now had a fully data driven decision made for them, fully automatically.
The next thing we are going to discuss are the scripts and usage of AI in this spreadsheet, as they were key to automating this process as much as possible.
VI. AI-Powered Comment Summarization: A Technical Breakdown
Before getting into the depths of the backend workings of the scripts which powered the automation aspects of this spreadsheet, we will mention that this is going to get technical. We are going to describe everything in depth, however, not at the level of a full beginner. So if you are interested in the technical workings of this, please feel free to read further. If not, you can go to the next sections to read about the results and outcomes, along with the conclusions and lessons learned from this project.
To start off, there was a three pronged tech stack used to create the scripts which powered the automation of this spreadsheet, and they were:
Ollama → Local backend system for running AI Large Language Models (LLMs), this was used to process the data from the spreadsheet
Claude + Visual Studio Code (VSCode) → Claude wrote the Python programs which did the automation steps, VSCode was the code editor that we used to interact with and adjust the code as necessary
Terminal → Terminal window on Mac, this is where the code ran and where the output logs would be viewed in real time
There were some other miscellaneous things, such as Raycast being used to launch the code rather than the terminal (personal preference) and Open WebUI for hosting the frontend of Ollama, however, these are not critical to the execution of the scripts and come down to user preferences. The intern director and hospital did NOT see either of the Raycast or Open WebUI items as those were simply some of the tools that we used at Ushiro Labs to run the script. They are not necessary for the automations to run, and the automations can and do run just using the three items explained earlier.
Now that we’ve introduced the tech used, we can get into how they were used and what their role was in the automation of this spreadsheet and data processing
Ollama
Ollama is a free, open sourced tool which allows your to run LLMs locally on your own computer.
Usually, whenever you want to use AI you go to chatgpt.com, gemini.com, or any other AI which you like. Some context with how these websites work is that you go to their website, you ask their AI model a question, and you then essentially ask OpenAI or Google to use THEIR resources in THEIR data centers to process your query, and return an answer. You’re using all of their resources to use the AI. As you may know, AI can be expensive to run and requires a good amount of power, both electricity and computing power, this is why companies have very limited free versions of their AI and you’ll often hit chat limits very quickly on a free model. They want you to pay for a premium model because it costs money to run these models and use their processors and power, and they need to recoup costs somehow.
A few years ago when these LLMs really started to take off, the problem that there used to be was that these LLMs were so large and so resource-intensive to run, that the only way that you could effectively run these models was through using the resources of these companies offering the LLM. However, as time has gone on, computers have gotten more powerful, and AI has gotten more efficient at running. Right now, if you have a laptop that has 16GB of RAM, you can run models like Llama 3.1:8b, GPT-oss 20b, and MANY more, all locally! And these laptops aren’t expensive either, an entry level Macbook Air with an M4 chip and 16GB of RAM is only $1000, whereas back in the day you would need to pay 2, 3, maybe even $4,000 for a computer with good enough specs to let you run even the smallest LLM locally.
With these progressions in technology, we now have the ability to run these LLMs on our own machines. We won’t get too much into why we at Ushiro Labs believe running LLMs locally is better, but a few reasons include:
No chat limits and no more “ you can continue this conversation at 9:00 PM” since everything runs locally on your machine and a company isn’t trying to profit off you
Access to as many models as you want (within range of whatever your computer specs can handle of course)
Full privacy, you own your data and it stays on your machine, so a company like OpenAI or Google can’t sell or use the data they collect on you through their AI
Usage 24/7, even if you’re offline or in an airplane, you can use your local LLM since it’s fully loaded onto your machine
Arguably the best benefit, it’s completely free! No limited free tier with an upsell to a more expensive plan, it’s fully free and unlocked from the beginning
Another important benefit of us using a local LLM is the cost of APIs. An API is a way for you to communicate with the resources of some other website. This API acts as a middleman between you and the tool you’re trying to use, so for example: You’ve probably gone on a website and seen that they have an “AI Customer Service Chatbot.” This is an example of an API. The business has their website which has this chatbot, they use an API to connect to ChatGPT for example, and then any chats you have with their customer service chatbot are sent to ChatGPT and processed, and sent back as a response to your question.
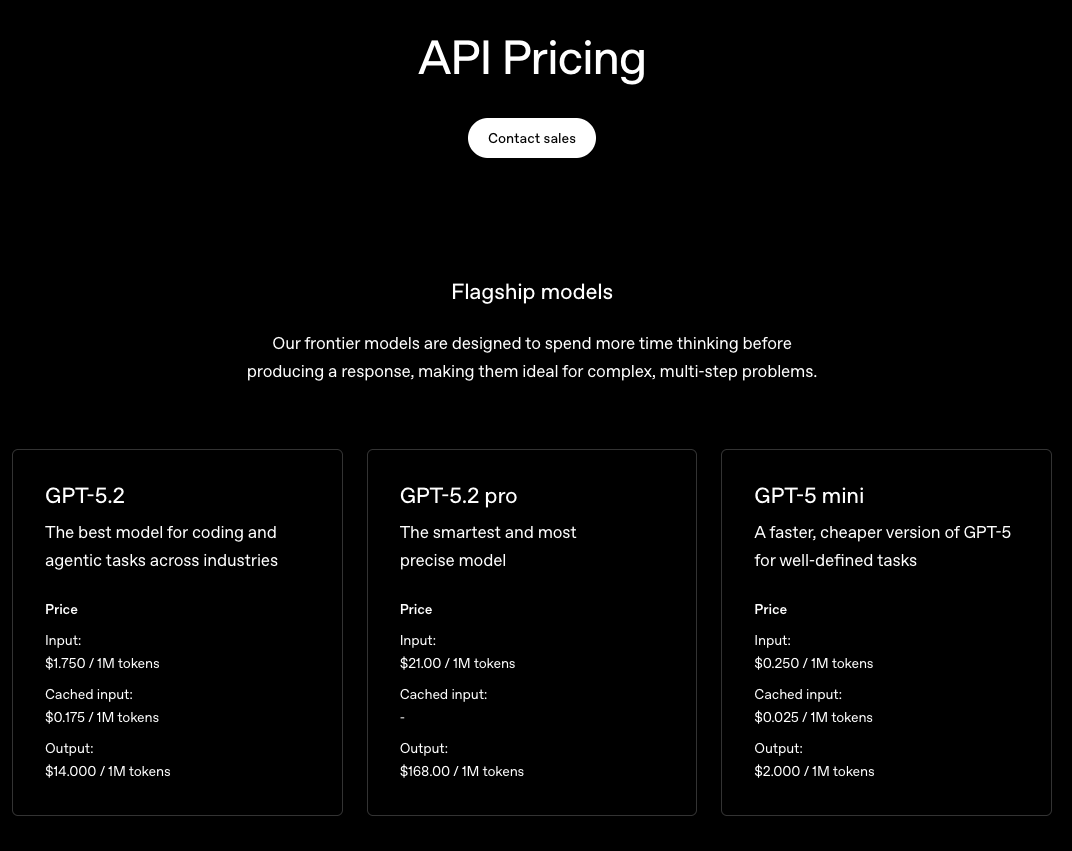
What many people don’t know is that this costs money, and quite a lot if you’re not careful. Like we mentioned earlier, these companies need to make money, and one of the best ways they do that is through people or businesses using their API. Each API query can cost anywhere from a few cents to a few dollars depending on the complexity of the request. We’ll use OpenAI and ChatGPT as an example. On their website, for the flagship GPT-5.2 model, it costs $1.75 per 1M tokens of input, and costs $14 per 1M tokens of output.
Your next question naturally is probably “what is a token?” A token is a small unit of text that LLMs process to understand and generate language. But, the complex part is that tokens aren’t all made equal. Sometimes, one character like the letter “a” is equivalent to 1 token, or sometimes 1 token can be a group of 4 characters/0.75 words. That’s kind of difficult to understand, but here’s an example that should be able to land home in terms of how big or small tokens are: If you took all of the collected works of Shakespeare and converted all ~900,000 words to tokens, that would be about 1.2M tokens. It might not seem like this is even possible to achieve, but we’re going to show you just how quickly this can add up
That in mind, even though it wouldn’t have cost much to use an OpenAI API for the hospital for this solution, we still wanted to give them a fully free solution that wasn’t reliant on the health of OpenAI as a company (meaning if OpenAI goes bust, the hospital’s automation will still run). So, by instead utilizing an API from our local LLM which is running completely for free on a local machine, the hospital didn’t have to pay a single penny for the use of AI for the data analysis and summarization.
We’ll also mention that of the may LLM models there are, we decided to use Qwen 2.5:7b model when it came to analyzing the data. Qwen 2.5:7b is pretty good when it comes to summarizing and working with data in that matter, so that’s why we used it (different LLMs have different strengths). This model was used to generate summaries of all of the comments received for each candidate, along with combining the score and summaries to assign a power ranking. Something to note is that EACH time this program was run, there would be a separate API call for each summary, and for each power ranking.
One way that we considered modifying this program is by reducing the amount of calls, so instead of going line-by-line for each summary of comments and power ranking and calling the AI each time, we would store all of them in a matrix, send that massive matrix to the LLM, and then it would return the summary or power ranking in one call instead of the 82 total. We decided against this because one flaw with AI is that the longer it works, the worse it’s responses get. You’ve probably noticed that if you feed in a massive query into an AI, the answer if good for the first little while but as time goes on, the quality dwindles drastically. We wanted to avoid this drop in quality, so the best way we could guarantee the same output of quality for each candidate was by having the script go row by row and send a separate API call for each row to process the data.
So, running this automation for 41 candidates means 41 different API calls to summarize each of their comments, and 41 different API calls to assign a power ranking. That’s 82 calls each time you run this program. Now, let’s go another layer deeper. If we take our prompt that we were plugging into the AI model for the comment summary for one candidate, the prompt itself was 65 words (99 tokens) and the collection of ALL comments the candidate received from all of the doctors, that’s another 441 words (594 tokens) on average. So, to summarize the comments for one candidate, the input would be 693 tokens. Multiply that by 41 and our total input tokens EACH TIME we run the program is 28,413 tokens, and that’s just for the input. If we take the output generated for that at an average of 250 tokens, that’s 10,250 tokens for all of the outputs, bringing our total token count just to summarize the comments for all candidates to 38,663 tokens.
Now, if we take the power ranking as well, which takes the comment summary and also the score and returns their power rank, this will be slightly less intensive so we’ll assume a multiple of 1.5 instead of 2 to the original number of tokens just for summarization to get our total token count each time this program runs. Original tokens times our multiple for the power rankings leaves us with a total of 57,994.5 tokens each time this program is run, but remember that input and output tokens have a different cost associated with them so this number is just to show how many tokens this program uses.
Using a cost calculator and inputting our totals for input and output tokens, along with the number of API calls, our total cost each time this program runs using GPT-5.2 would be $0.38. So, not even two quarters to do all of this, but that’s every time you run the program, so costs will only go up with added complexity and candidates, and also if for some reason you run this program 10 times from the start of the candidate review window to the end, that’s $4. These costs can really add up quickly if you’re not careful.
That concludes the contribution that Ollama made to this automation solution. The next piece of the puzzle writing the actual script that would do the data analysis, and this was done with Claude and VSCode.
Claude & VSCode
These two tools were the main ones for generating the python program that would actually talk with and instruct our local LLM on what to do. Claude is an AI made by Anthropic, and it’s strong-suit is technical based queries and output, and it especially is known as the gold standard among LLMs when it comes to generating code. Claude generated the code for us and we used VSCode to edit the code. VSCode is a code editor which obviously lets you edit code. A trend that’s pretty popular nowadays is “vibe coding” where you just prompt a coding LLM to make something for you until you get the end product you desire. Although this is great and lets non-technical people dip their feet into programming, it isn’t a sustainable solution long term since you really have no idea what’s going on as you vibe code, so that’s why it is important to make sure you at least have an understanding of what is going on in the code.
Although Claude wrote the bulk of the code for our programs, we did go through and manually edit and adjust things as necessary and as we desired. This was only possible because we were writing in a language which we already knew (Python) and already had experience in Python so it was easy for us to understand what was going on.
That being said, there were two main programs that we used for this spreadsheet to automate things, and those were the items previously mentioned: summarizing all of the comments that each candidate got from the doctors, and then taking those comments along with their average score from 0-5 and assigning a power ranking from 1-41.
First, we are going to dive into the comment summarizing program.
This program worked in the following way:
Open spreadsheet → Navigate to the page where the raw data is → find the data in the row that it needed to summarize → Call the local LLM model → Prompt the local llm to summarize the comments that the script just collected → LLM summarizes → Take the summary from the LLM and insert it into a specific cell in the spreadsheet → Repeat with all 41 candidates.
Another step in this is that in order to actually get this script to be able to access the data in the google sheet, we needed to write a google apps script and generate an API Key for the spreadsheet in order for it to be allowed to communicate with the script in the way we wanted. We won’t get into the details of this, but basically, we wrote a script for google sheets that would allow our python script to view and open it. For this, we also needed to create an API Key which allowed our summarizer script to pull the data from google sheets to process it. An API Key is basically like a key to a front door with a window. Without it, you can only see what’s inside through the window on the door, but with the key, you can open and take whatever you need.
So, after we got the google sheet ready to actually allow our summarizer script to look at what data there is and actually pull out that data, we began working on the actual summarizer script. Since this script is private we can’t show the full script, but we will explain how it worked and show a few small sections of it.
There were four main sections within the code
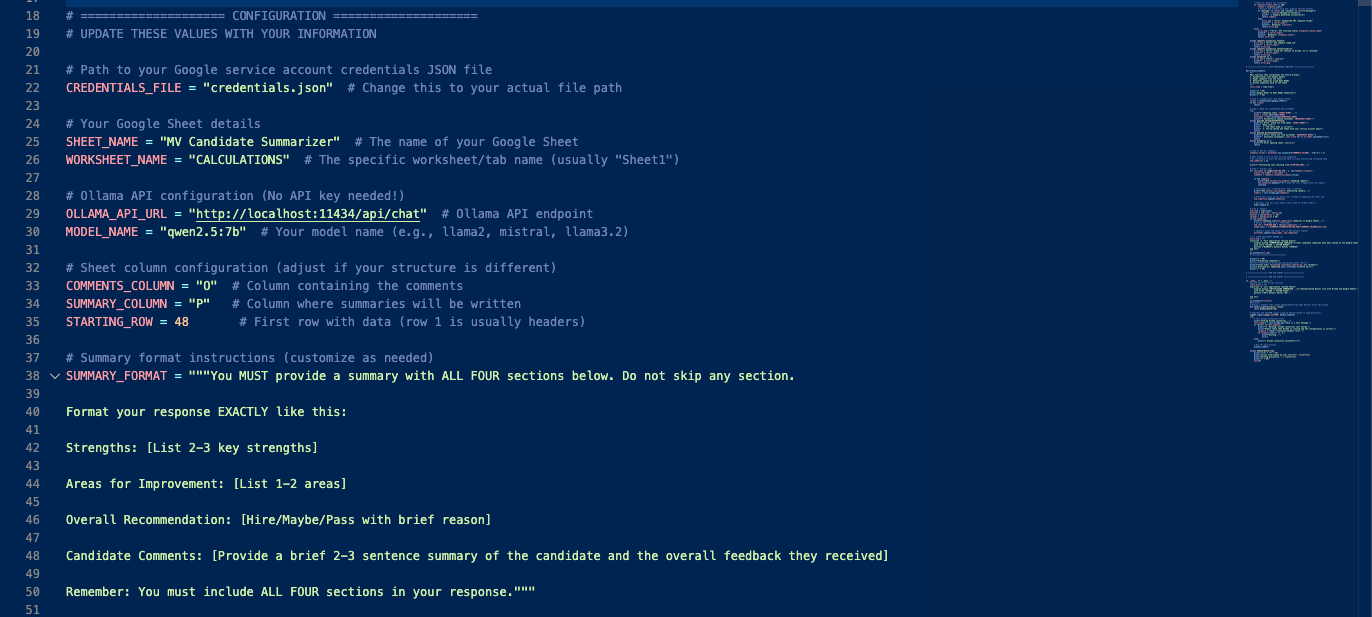
The Configuration → This is where we explicitly told the script data it needed. This includes
The API Key for the google sheet so it can access it
Where in the google sheet it is looking for data
The API Key for the local LLM and the model from our local LLM it is going to use to summarize the comments
The prompt that it would run through the LLM to summarize the comments in the format that we wanted
The Authentication Function → This was a function to actually authenticate the connection with google sheets and show that everything was properly configured and it was able to access google sheets
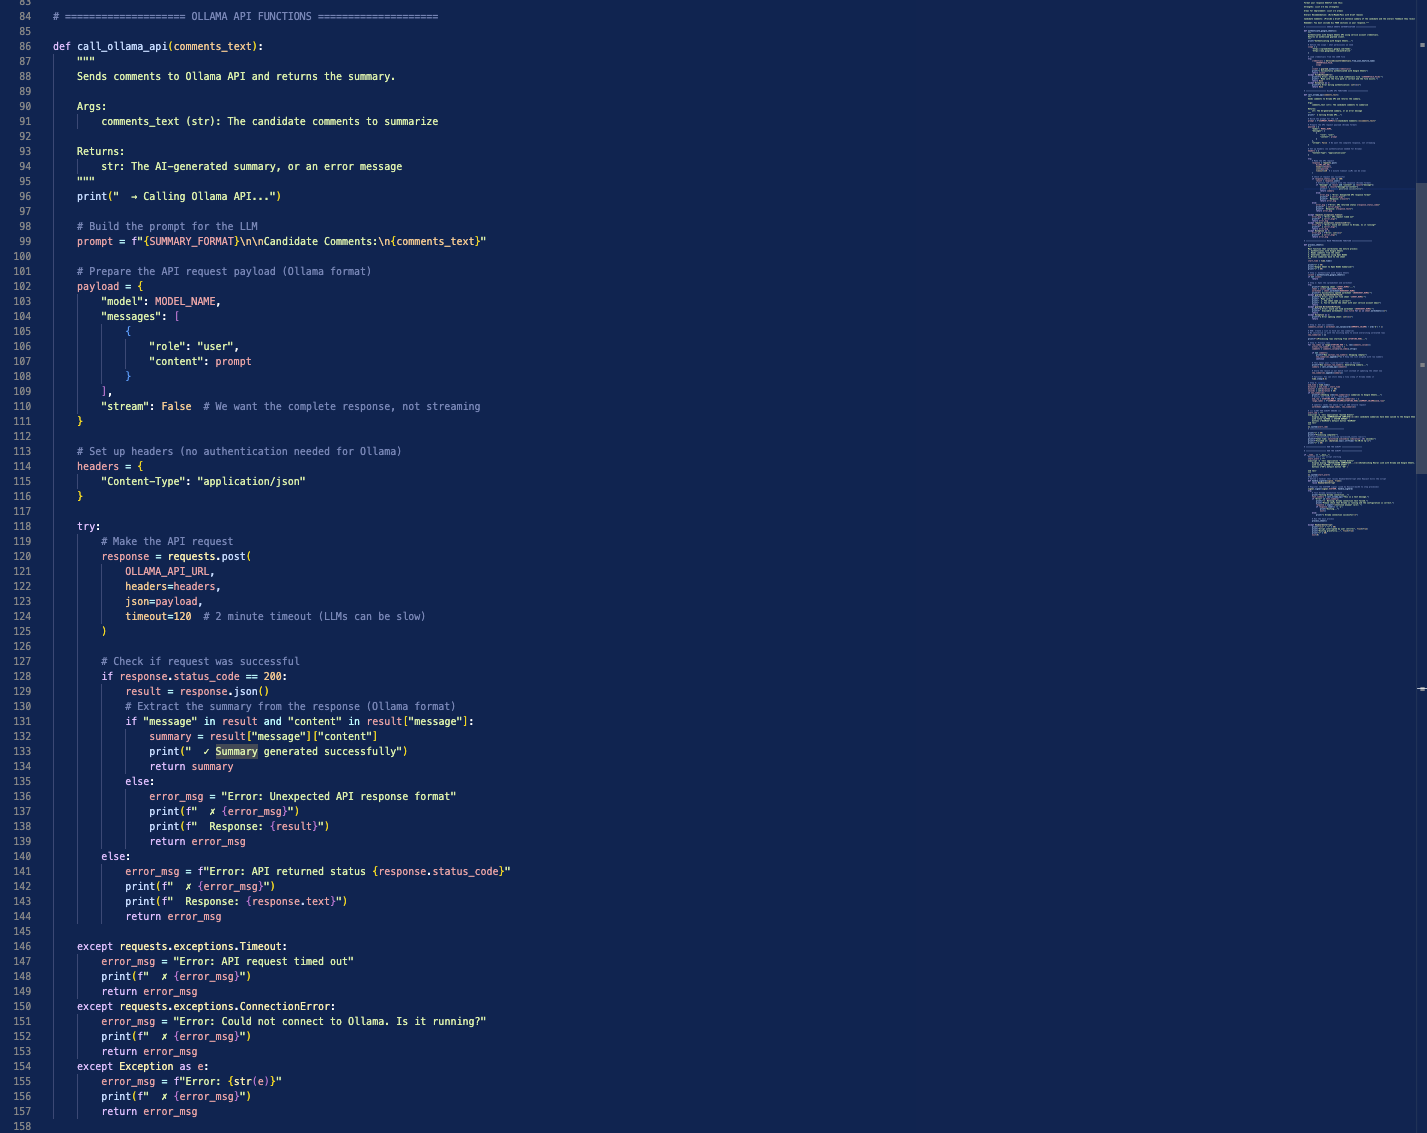
The Call Ollama API Function → This was a function to call our local LLM, and send the comments extracted from the google sheet along with the prompt to that LLM for processing
The Process Sheet Function → This is the function that actually brought everything together. It ran the configuration to validate the connection with google sheets, connected to Ollama and ran the summarization prompt with data through it, then when the summary was ready, it would take that output and insert it into the correct cell in the google sheet.
The script also had regular error checks and progress updates as it was running. This is a “best practice” principle when it comes to coding. Any time something is going on, you want some kind of feedback from the program so if something goes wrong, you actually have an error message and you know where to look. If you don’t have proper checks and error messages throughout the program, you’re going to be shooting blind when it eventually does break. A few snippets of the code are shown below:
This script was written and worked as expected, and it’s output logs were output to the Terminal on the computer (we used a Macbook Air M4 to run this) to monitor progress as it was running. The video below shows this script in action, with all of the syntax as well. Something to note is that each run of the summary script takes around 10 minutes, so the video is sped up to accommodate that long time. The left side of the screen shows the spreadsheet, and the right side shows the logs in the terminal for the summaries. In this video, the script to calculate the power rankings was run in the background as the summarizer script was running and is not shown since it is essentially the same thing as the summarizer script, just with differently labeled logs. We did this so you could see the entire final result in the FINAL sheet once it was done running.
As mentioned, along with that script, we also had one for the power rankings of the candidates. We won’t get into the details on that one, what’s important to know is that it worked the exact same way logically as the summarizer script, it just had a slightly different way of inputting data and its output was a number 1-41. This script was slightly faster, only needing about 7 minutes to run. So, end to end to run this entire automation was ~20 minutes. This can run and operate in the background, you don’t technically need to monitor the logs as it is running, but sometimes it’s good to do so.
Once the scripts were run, in the CALCULATIONS sheet, each candidate had their comments summary input into column O for organizational sake, and then this was pulled into Table 2, Column I in the SORTING sheet. The power rankings were automatically entered into Table 1, Column B of the CALCULATIONS sheet. Once these were populated, they were then automatically pulled into the SORTING sheet and auto assigned to the correct candidate. After that, all of the fully filled in and completed entries in the SORTING sheet were pulled into the FINAL sheet and sorted from 1-41 with color coding.
Terminal
This section is small but it covers an important one, and this is the computer terminal.
It was mentioned in the last section that the programs would automatically run and the output logs would be visible in the terminal. The terminal was the window on the right hand side with all of the fun colors that was running and showing logs. This is where you would actually instruct your computer to run the script, and also see how the script is progressing.
As we mentioned at the beginning of this section, we at Ushiro Labs actually use a program called Raycast as the main launcher tool on our laptops, and one thing that it can also do is launch our scripts. Launching from Raycast is the exact same as launching from the Terminal, but rather than opening up a terminal window and typing in the command there, we just have that command built into our Raycast to quickly run it from there since we use Raycast so extensively.
Small tangent here, the terminal is actually a very powerful feature on a computer that not many people know about. It’s the built in command-line interface app which lets you talk directly to your computer. To help explain this, when you open an app on your laptop, say Safari, what actually goes on in the backend is you press the Safari icon, then a command is sent directly to your computer to open Safari in a language the computer can understand. What the terminal does is say you want to launch Safari from your Terminal, what it does is it bypasses the need to click on the Safari icon, and you just directly type to your computer the command to open Safari (that command is open -a safari in case you’re curious).
So, when we ran our script, we were just directly telling our computer “do all of these things which we’ve outlined in our script for us” and from that point, we were hands off and the program was doing its thing. So, you can think of the scripts as the instructions for the computer, and then you tell it exactly what these instructions are in the terminal, and it’ll go and do it.
VII. Results & Outcomes
After going through all of that, we are happy to say that all of our goals that we set with the intern director at the beginning of this project were met, and by many marks, exceeded. Here are a few key metrics to show the effect that this spreadsheet had on the performance of the team:
20+ Hours of Total Work Saved for the intern director across summarization of candidate comments and doctor opinions (also countless hours saved for the other doctors participating and giving feedback)
40% increase in the response rate from Doctors
Decision making system went from little data and largely qualitative, to fully data driven with a good balance of quantitative and qualitative data
Repeat system created to be implemented in perpetuity for all intern classes
$0 to use the system itself, runs fully locally without any additional costs
Deadline for comment submission met (past years the deadline was pushed back to accommodate tardiness)
Also, from the Hospital Intern Director herself:
“Ushiro Labs was a game changer for our intern interviews. By automatically averaging candidate ranks and summarizing doctors' feedback, it streamlined our review process and saved me hours while improving clarity and consistency in candidate”
VIII. Conclusion & Lessons Learned
Here at Ushiro Labs, we successfully delivered a customized automation system that streamlined the intern selection process and improved many metrics throughout the entire life cycle of the intern application review cycle. We learned a lot from this experience, and were able to take many things away from this one, including:
The importance of understanding the client’s needs and goals from the outset → Without this, we would’ve likely wasted time and not had a clear vision of the final result that we wanted to deliver for the client, and this would’ve delayed the project, leaving all parties disappointed.
The value of technical expertise and using a combination of automation tools to streamline processes → Without having a technical background, it can be difficult to imagine how these different tools interact with one another. If we didn’t have a background with coding and understanding the syntax, it would’ve taken much longer to make sense of and refine the software scripts which enabled the automation of this system. Having that technical know how is a great asset, and it is what can really set things apart and move the needle
The need for clear communication and collaboration between team members and the client → We were in constant communication with the intern director and were constantly getting a feedback loop from her. Here at Ushiro Labs, we believe that iteration is a super power. A lot of companies will get a project description, work on something, then deliver a final product to the client with little to no feedback during the build process, and only at the end they find out that they completely missed the mark. This delays things much more than you would expect, so we make it a priority to be in constant communication with the client and provide consistent updates whenever necessary.
Even if a project is finished, it doesn’t necessarily mean that it’s over → We’ve already had discussions on ways that we could improve or refine this spreadsheet for the client in the future, and what kind of features they would maybe like to include now that they’ve seen what we at Ushiro Labs are capable of. Along with regular reviews and refinements during the build out, there is so much that you can learn from a formal review after the conclusion of a project. Not only does this constant reviewing and iterating benefit the current client, but it also helps any future clients since you’re building a culture of constant improvement.
As we continue to grow as a company and push the boundaries of what is possible with technology, we are committed to delivering exceptional results for our clients while fostering a culture of continuous improvement and innovation. By taking this approach, we can aim to deliver even more value to our clients in the future.